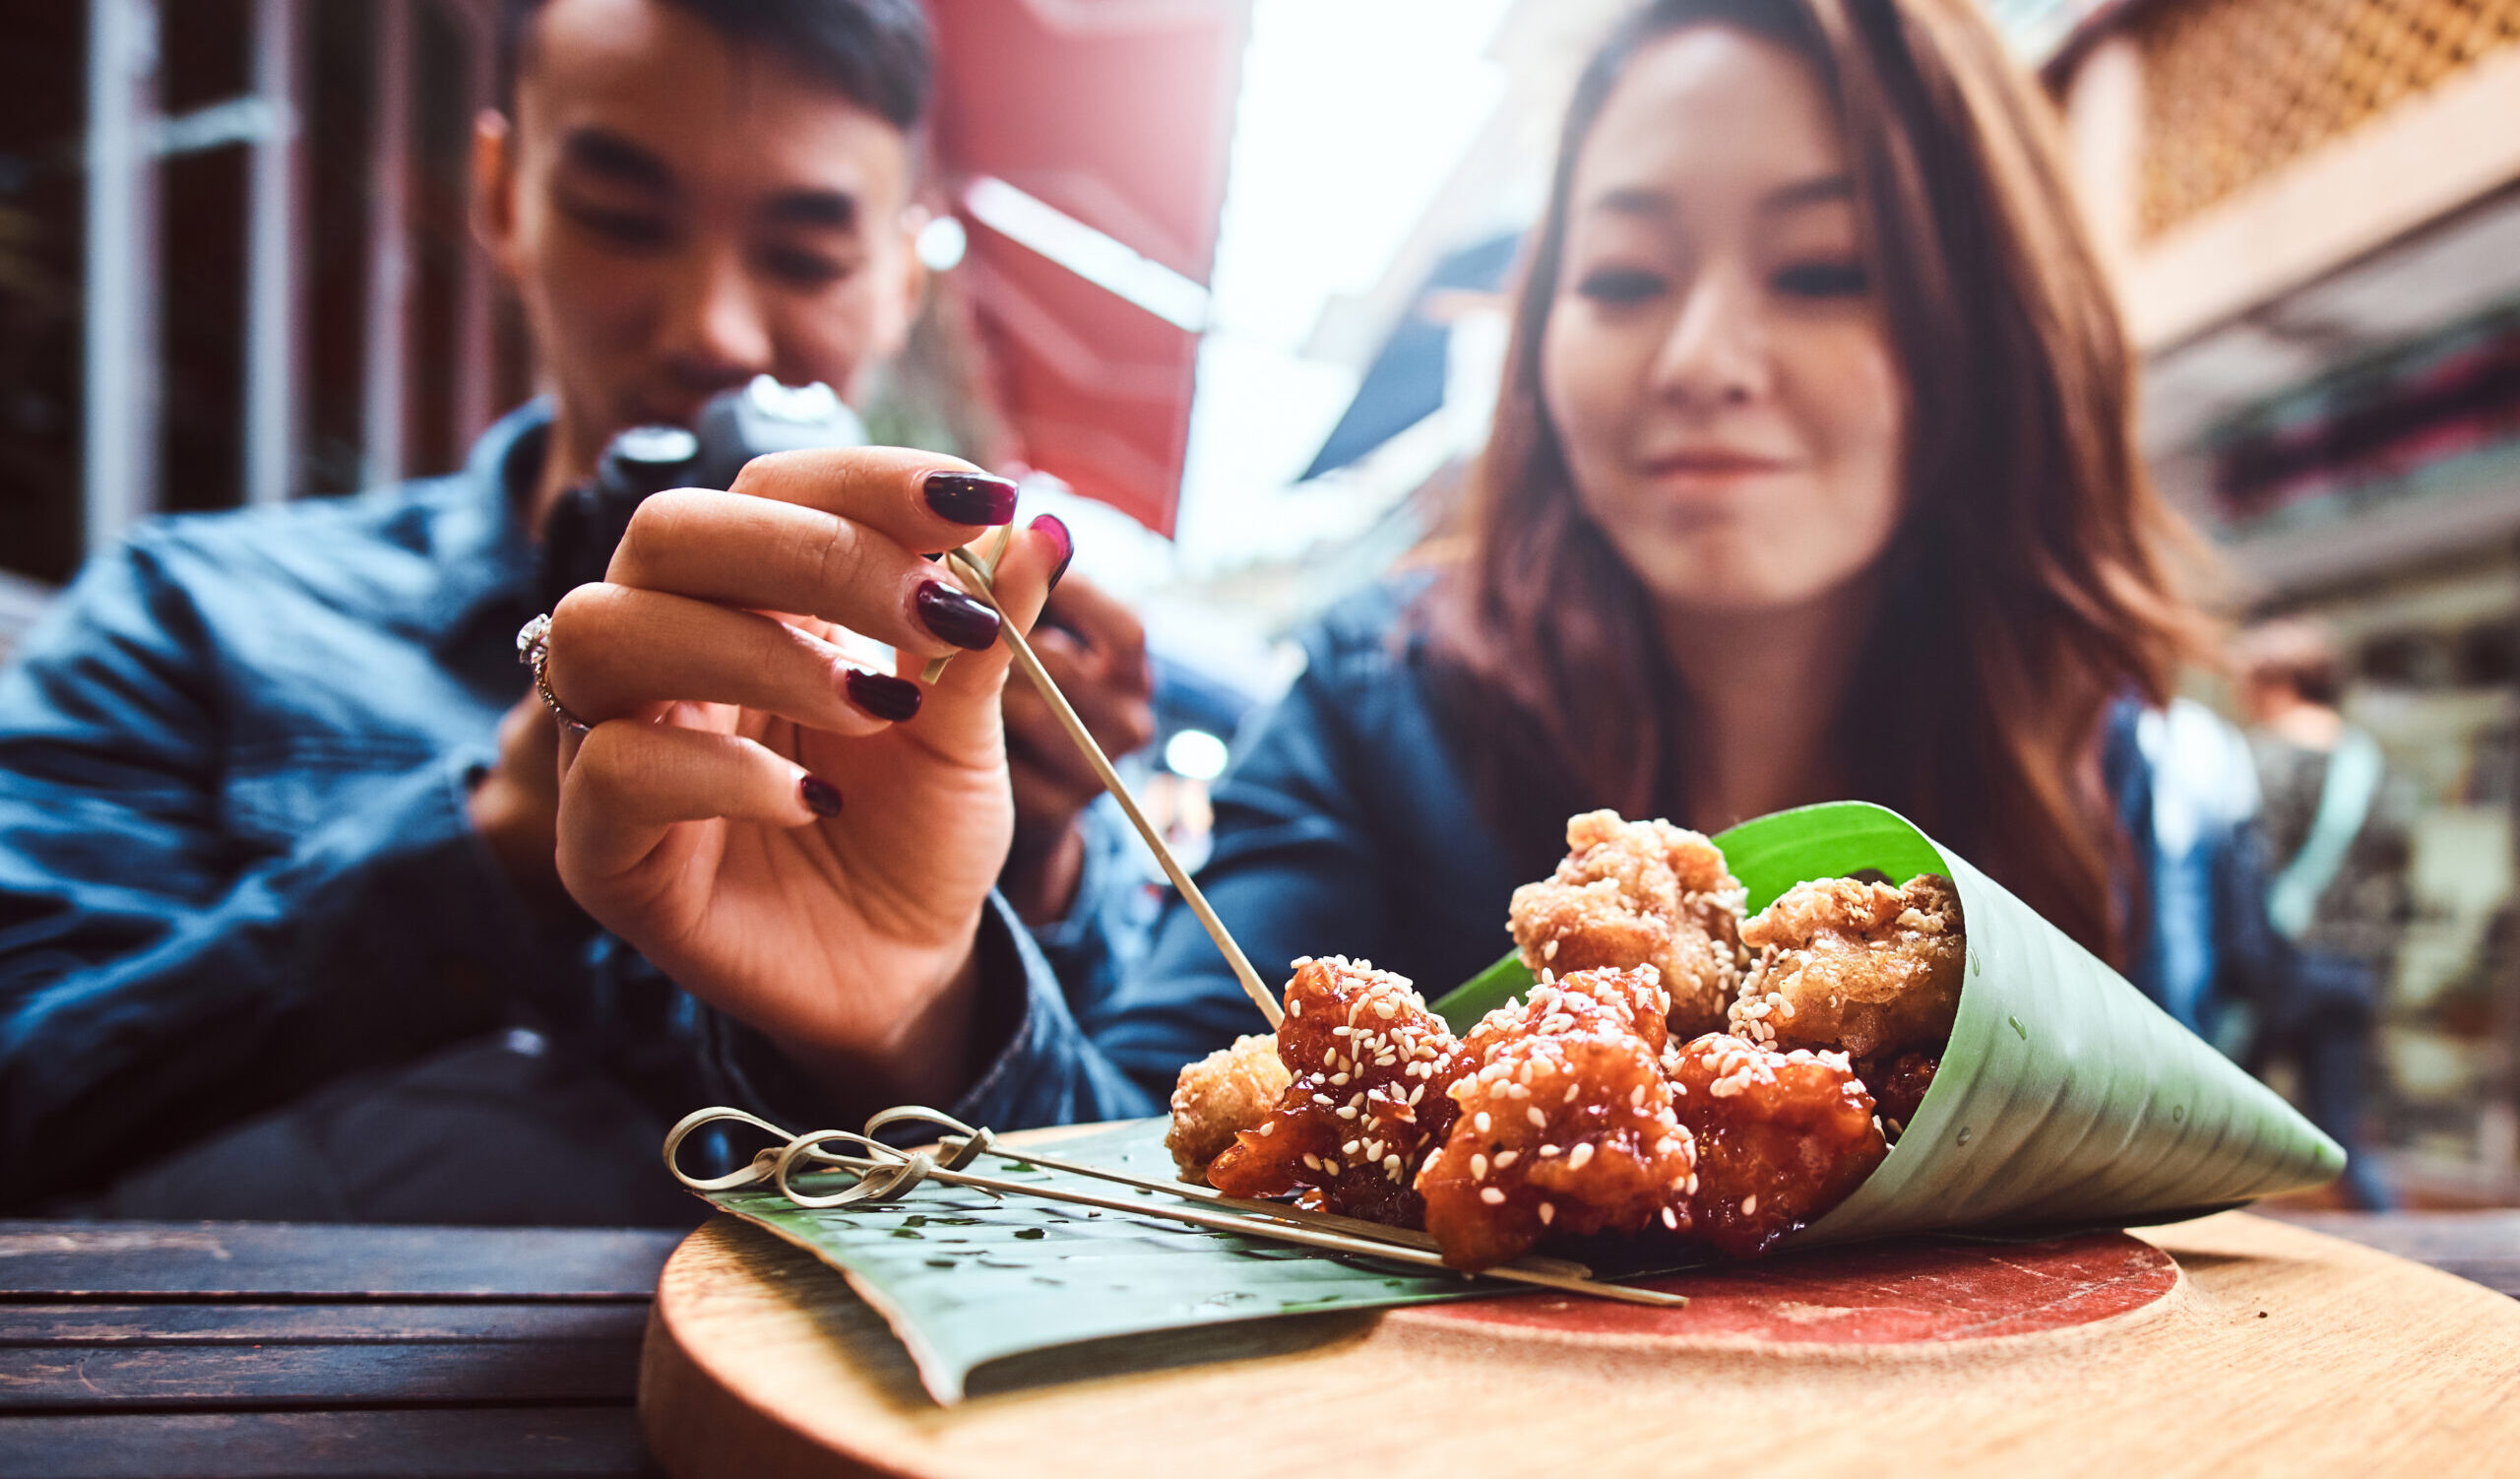
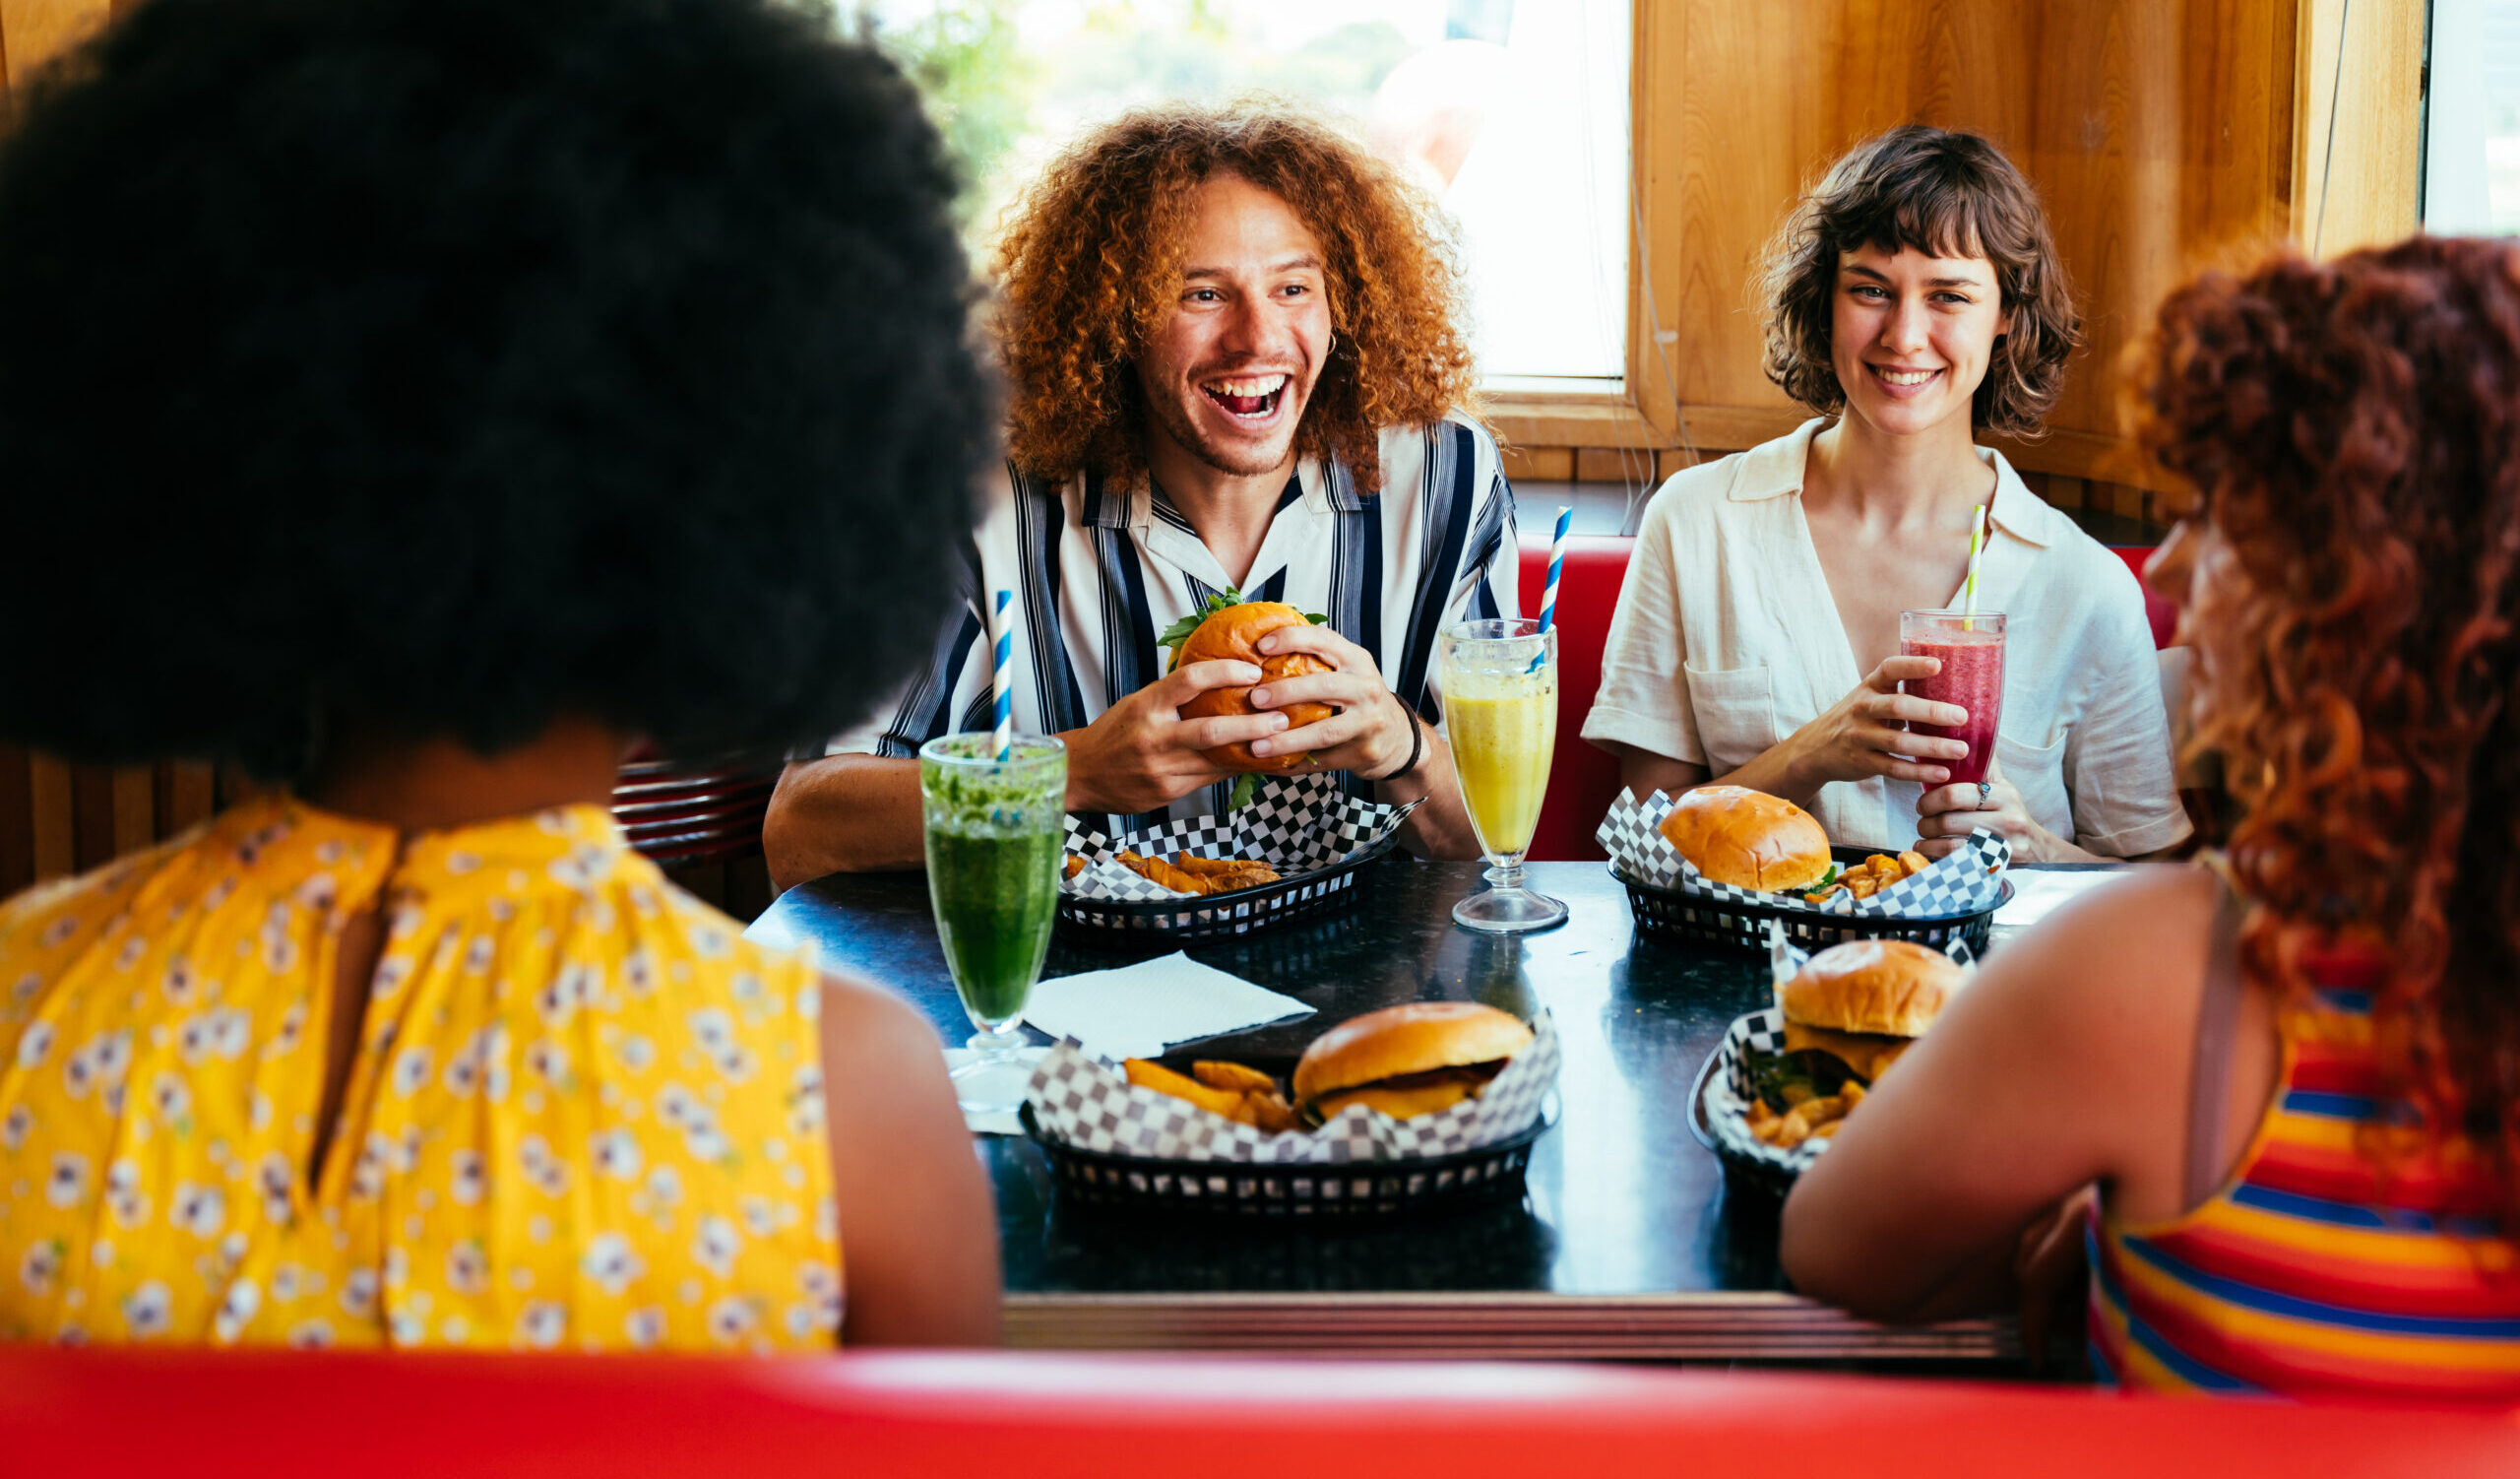
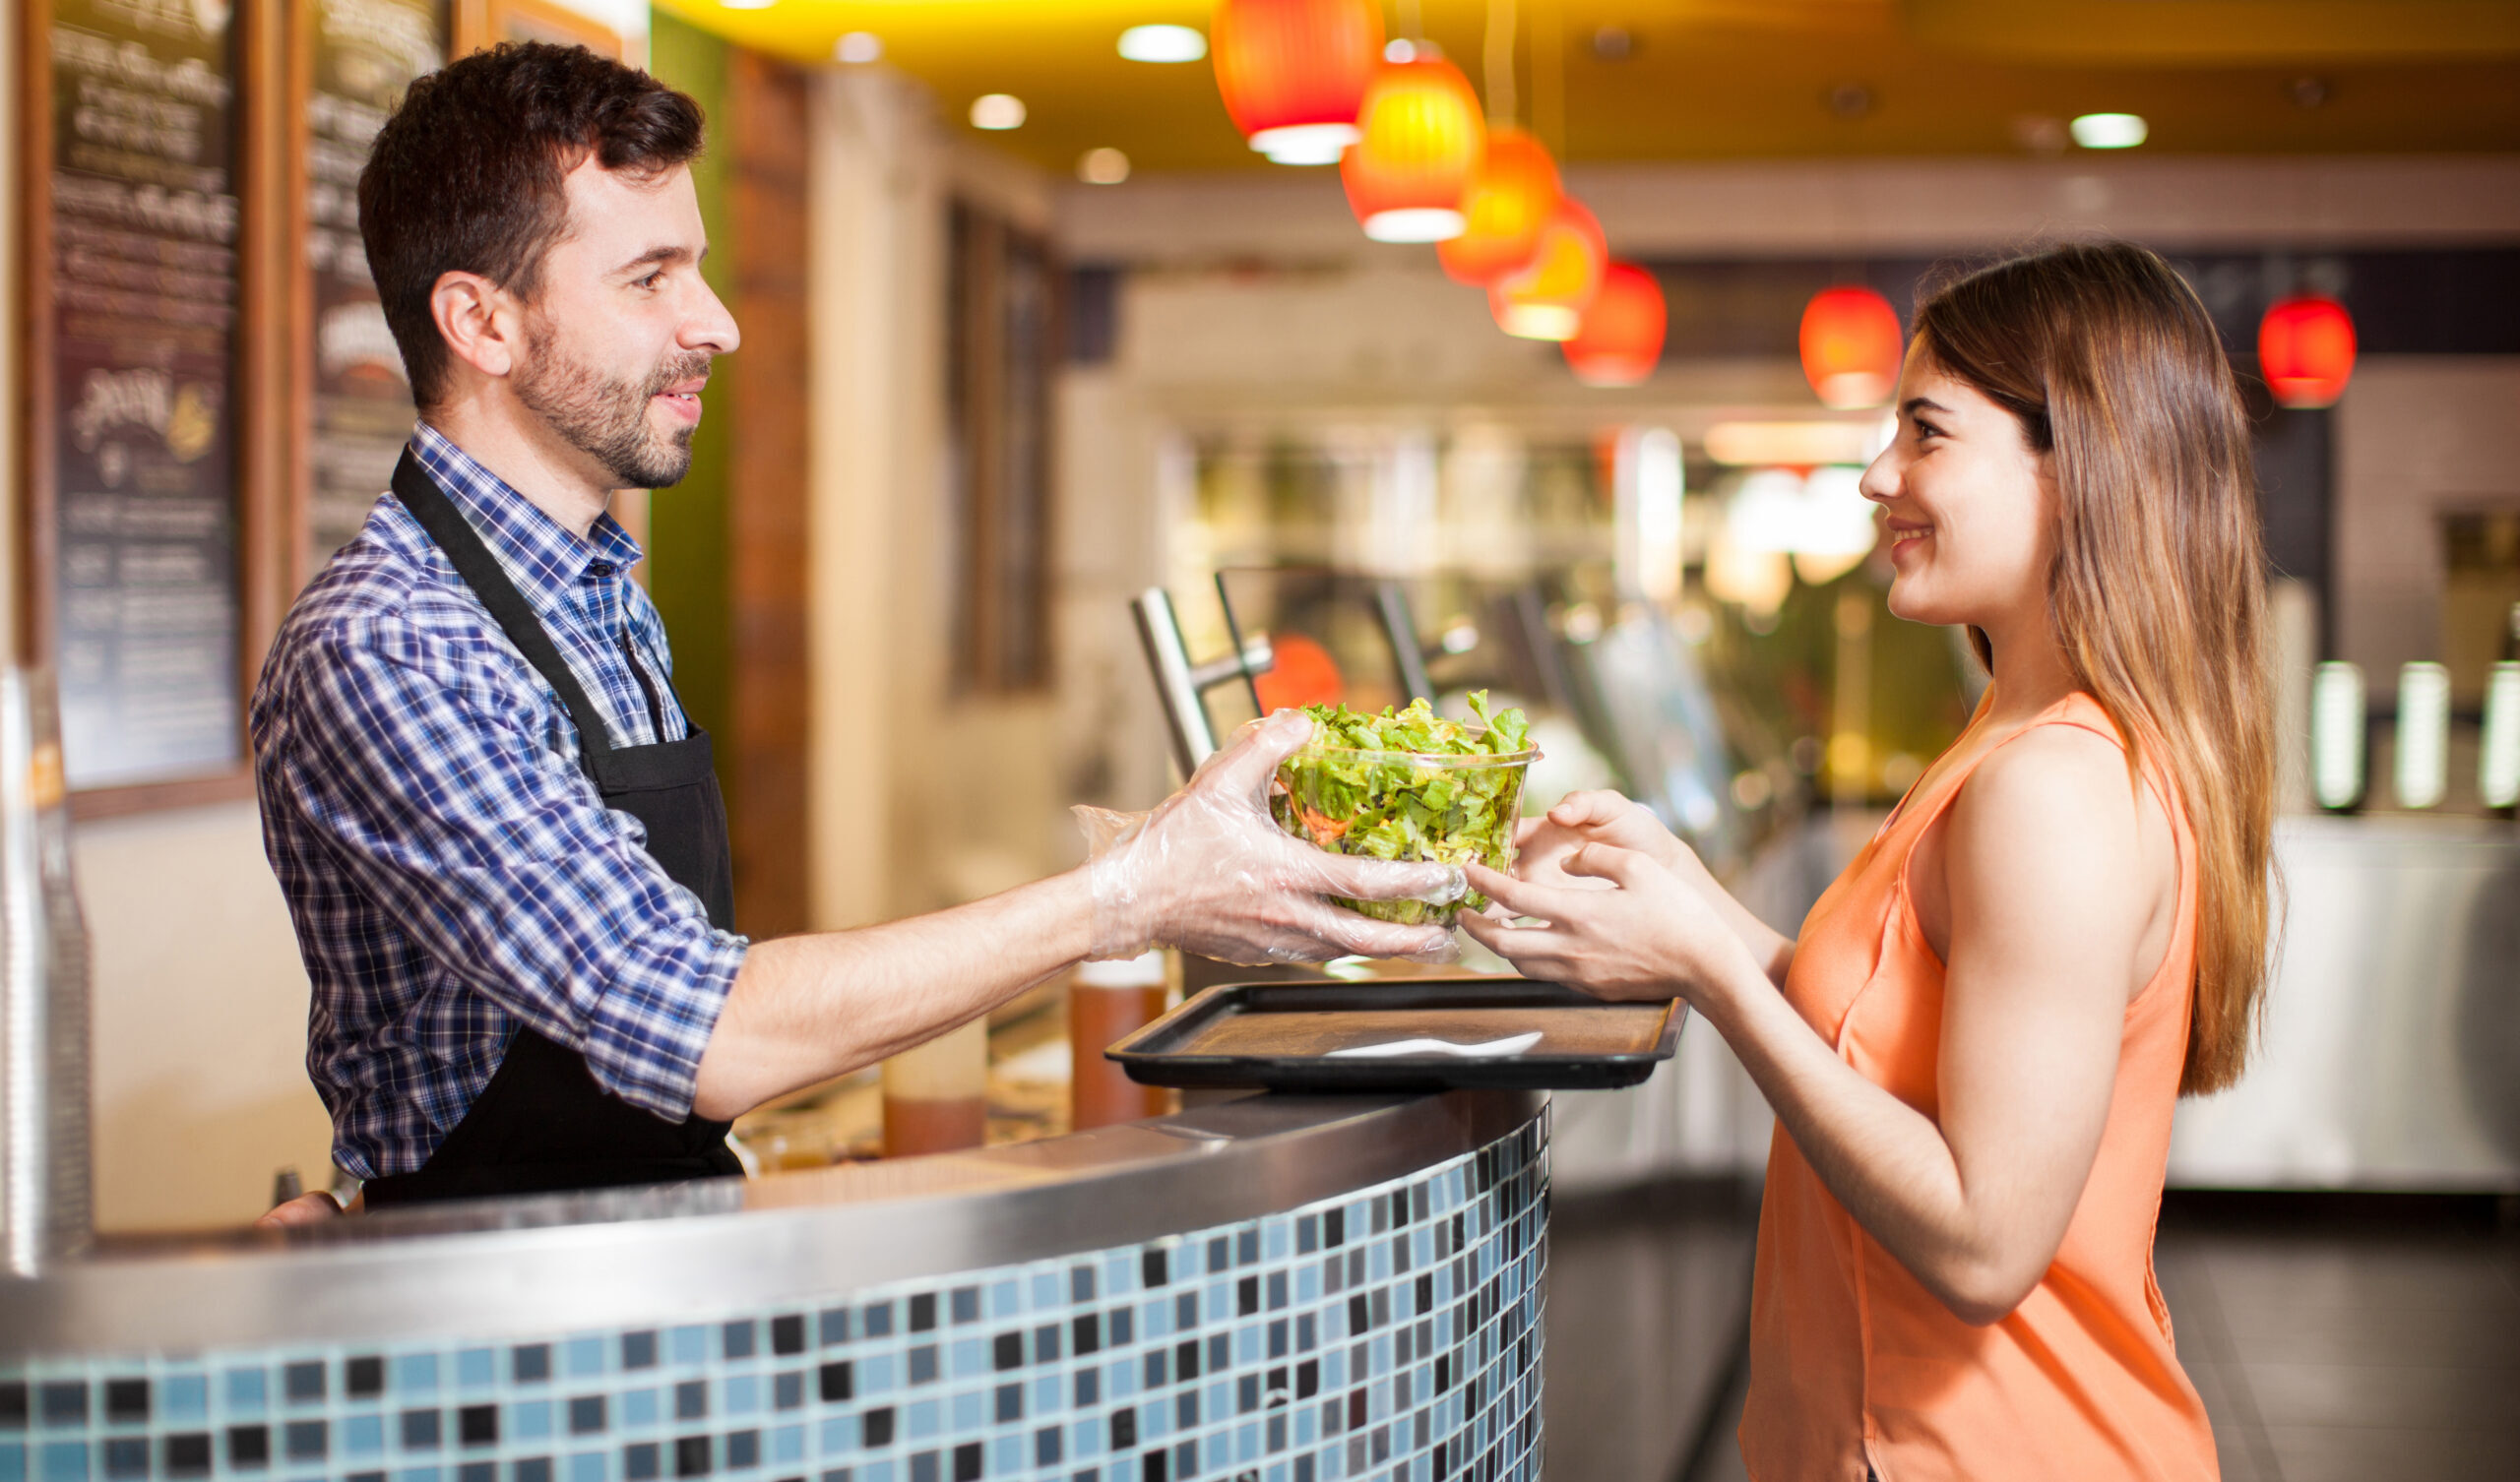
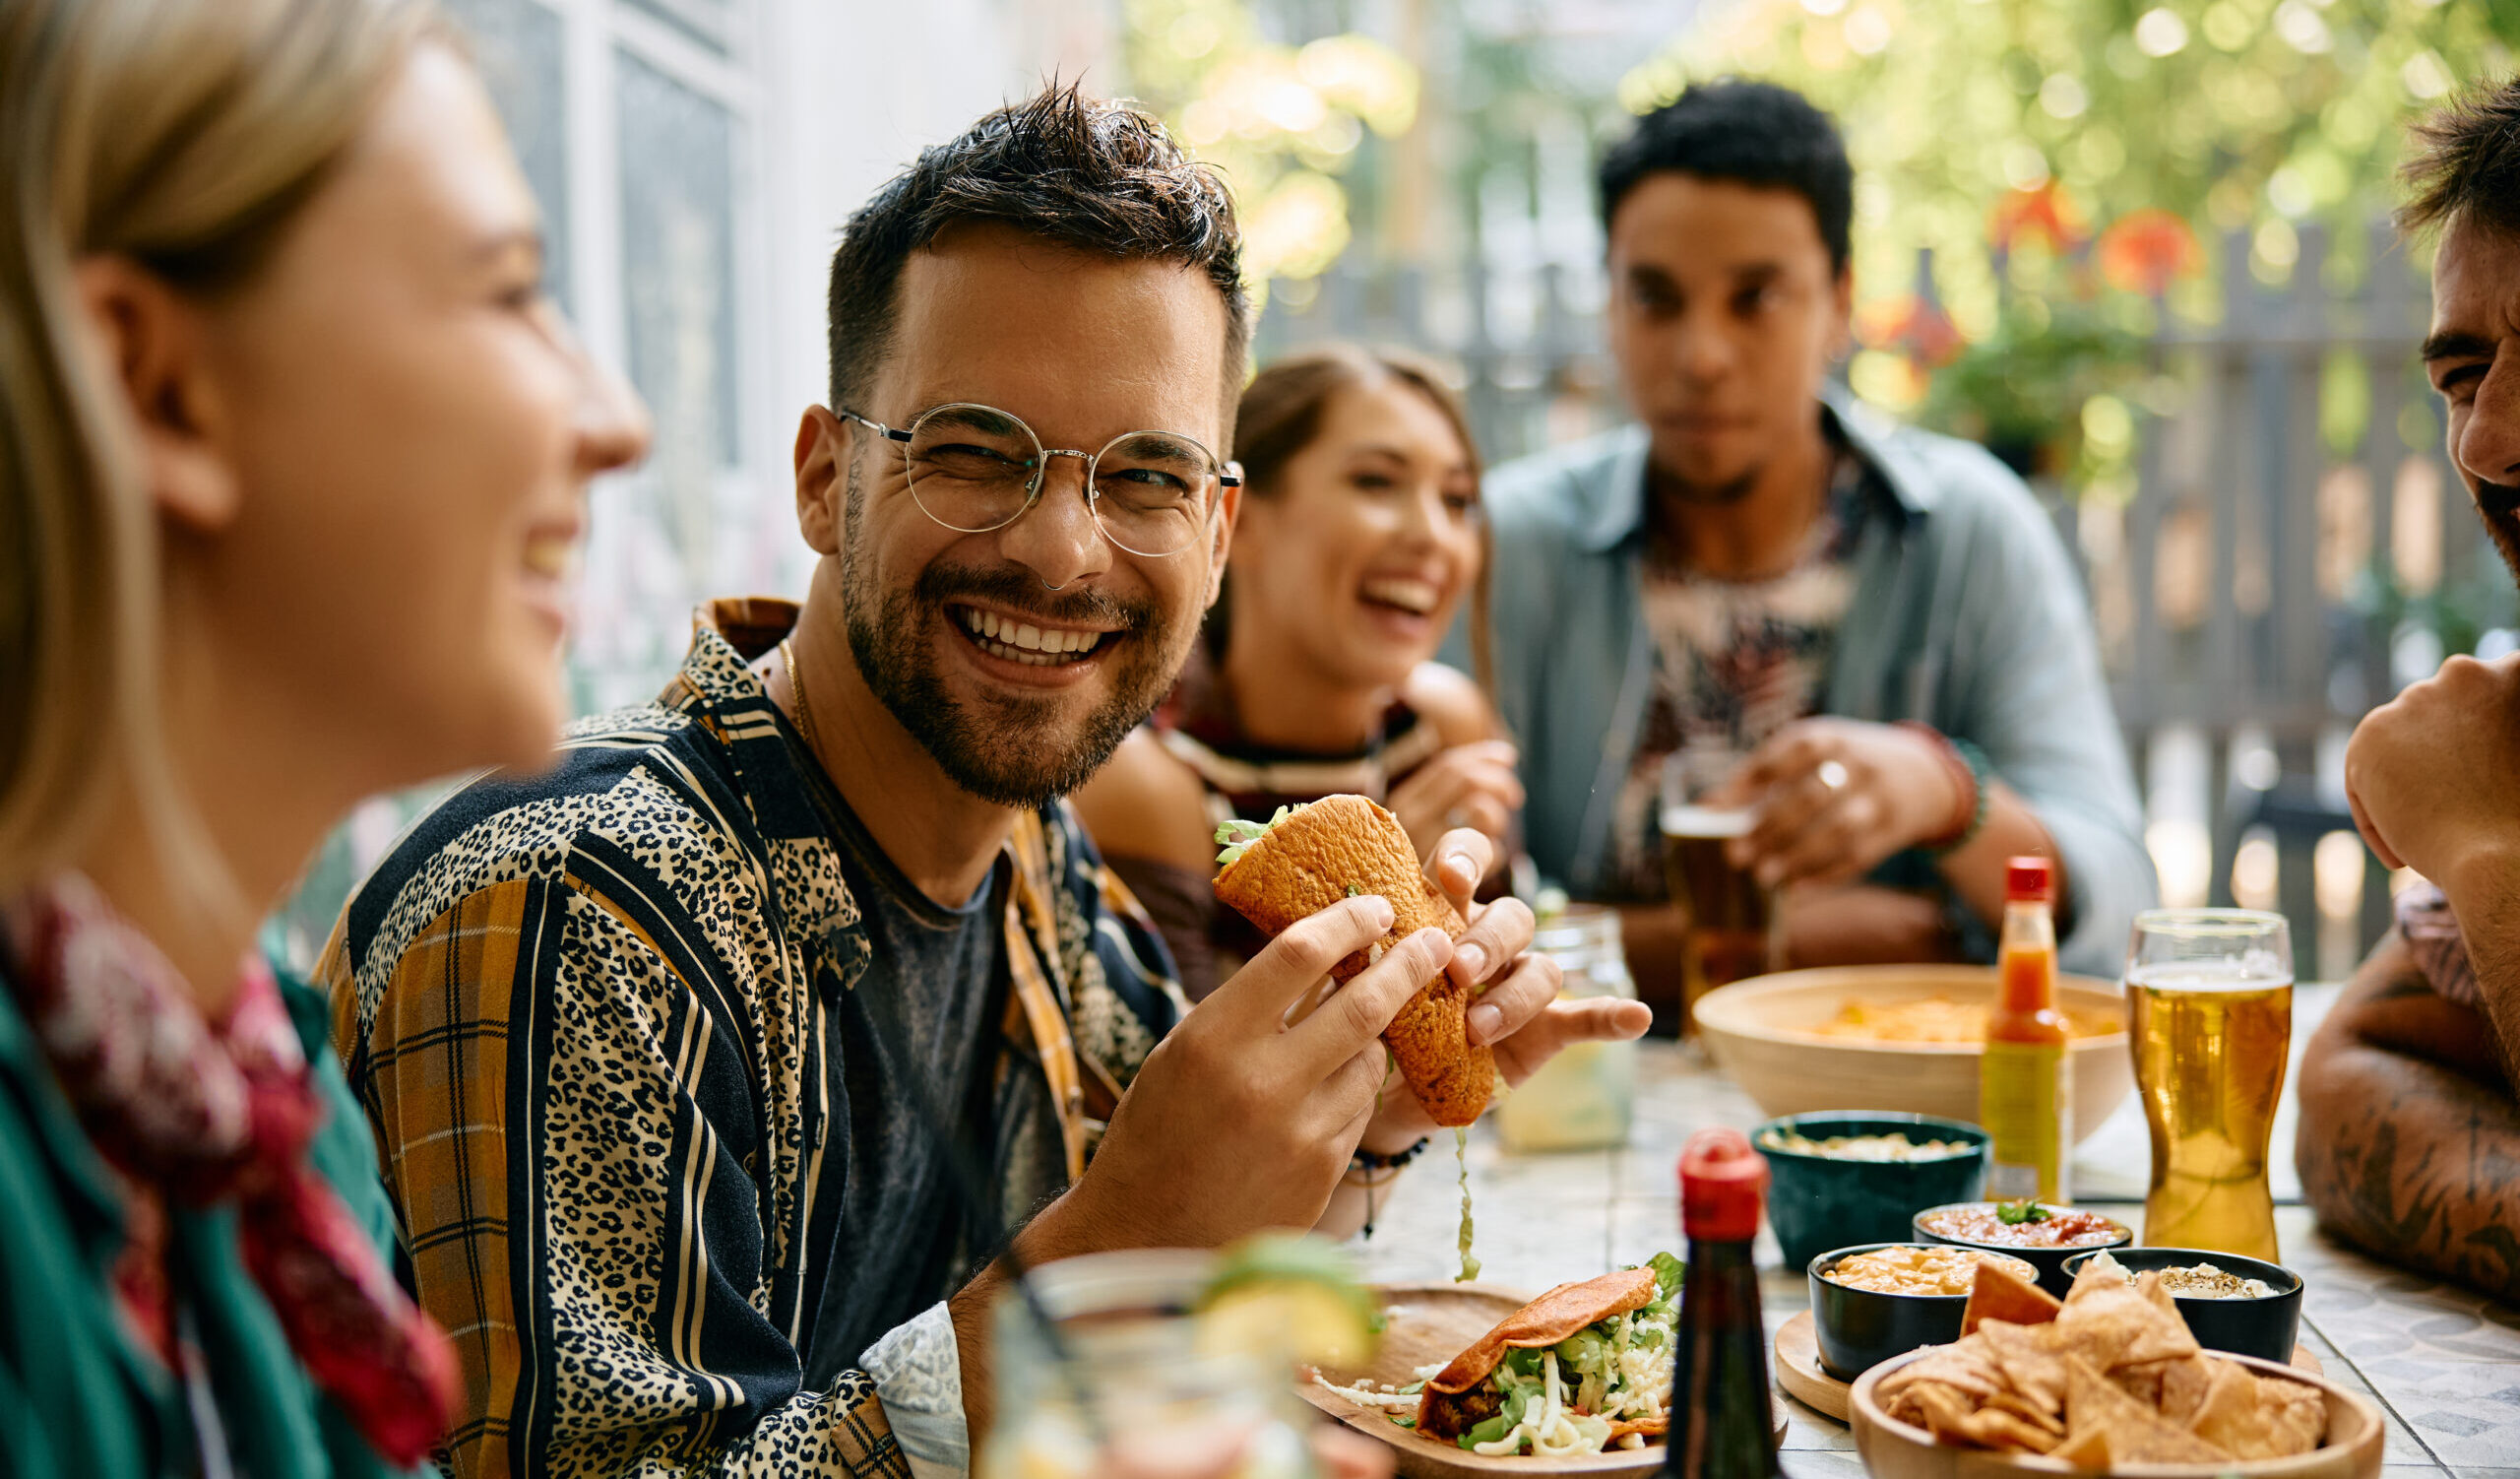
LoopMe surveyed 7,530 consumers in the US in June 2026 to gauge QSR ordering behaviors and trends.
One key finding: 82% of 18-24s order from QSR brands, well above the 74% national average.
Download the report to learn:
How many Americans order from QSR brands, and how does that vary by age?
What keeps 18-24s ordering from fast food more than any other age group?
Which food categories are driving the most orders across the US?
What decision factors should QSR brands prioritize in their messaging?
Why do restaurant apps and websites over-index among the most frequent customers?
What’s the most effective way to increase order frequency among lighter, less frequent customers?
LoopMe AI transformed the data into actionable audience segments, including:
Order frequency
Item(s) purchased
Important factors when choosing QSRs
Ordering methods
Restaurant mobile app usage
Contact pl_salesus@loopme.com to activate these audiences today.
Also available via:
LoopMe surveyed 9,142 Canadian consumers in June 2026 to gauge QSR behaviours and trends.
QSR has become a mainstream dining habit in Canada, with 64% of consumers ordering regularly.
LoopMe’s consumer snapshot answers questions including:
What share of Canadian consumers order from QSR brands each month?
How does QSR order frequency differ between 18-24s and the wider Canadian population?
Which menu items and cuisines are winning the most orders?
What matters most to Canadian diners when choosing a QSR brand?
Do mobile apps and self-service kiosks outperform drive-thru among frequent customers?
What’s the best way to turn occasional diners into weekly regulars?
LoopMe AI transformed the data into actionable audience segments, including:
Order frequency
Item(s) purchased
Important factors when choosing QSRs
Ordering methods
Restaurant mobile app usage
Contact pschlatter@loopme.com to activate these audiences today.
Also available via:
LoopMe surveyed 13,897 UK consumers in June 2026 to gain an insight into QSR ordering behaviours and trends
The results show that fast food ordering is highest among 18-24s, with 77% ordering from QSR brands. Download this research to understand:
What proportion of UK consumers regularly order from fast food and QSR brands?
Why do 18-24 year olds over-index as the heaviest QSR customers in the UK?
Which food categories are winning the most orders from UK diners?
What drives QSR choice for UK consumers — value, taste, or convenience?
How much more likely are Gen Z and millennials to order via app vs in person?
What’s the best way to convert monthly QSR customers into weekly regulars?
LoopMe AI transformed the data into actionable audience segments, including:
Order frequency
Item(s) purchased
Important factors when choosing QSRs
Ordering methods
Restaurant mobile app usage
Contact uk_agency@loopme.com to activate these audiences today.
Also available via:
LoopMe surveyed 9,464 Australian consumers in June 2026 to gauge quick service restaurant (QSR) ordering behaviours and trends, with the results showing that 59% of Australians are QSR customers.
Download LoopMe’s consumer snapshot for answers to the following questions:
How often do Australian consumers order from fast food and QSR brands?
Which age groups are the most frequent QSR customers in Australia?
What menu items and cuisines drive the most QSR orders in Australia?
What factors most influence QSR choice — price, convenience, or cravings?
Do third-party delivery apps attract more frequent QSR customers than drive-thru?
How can brands turn occasional QSR customers into weekly customers?
LoopMe AI transformed the data into actionable audience segments, including:
Order frequency
Item(s) purchased
Important factors when choosing QSRs
Ordering methods
Restaurant mobile app usage
Contact apac_agency@loopme.com to activate these audiences today.
Also available via:
LoopMe surveyed 15,784 Australian consumers between 14 – 16 January, 2026 to gauge supermarket shopping behaviours and trends.
PurchaseLoop Audiences transformed this research survey data into exclusive, actionable segments, including:
In-store, online, and hybrid shoppers
Factors driving supermarket choice
High-end, mid-range, and discount shoppers
Healthy shoppers
Supermarket switchers and supermarket-loyal shoppers
Activate these audiences in your campaigns today by contacting apac_agency@loopme.com
Also available via:
Download data for other markets:
LoopMe surveyed 18,042 UK consumers between 14 – 16 January, 2026 to gauge supermarket shopping behaviours and trends.
PurchaseLoop Audiences transformed this research survey data into exclusive, actionable segments, including:
In-store, online, and hybrid shoppers
Factors driving supermarket choice
High-end, mid-range, and discount shoppers
Healthy shoppers
Supermarket switchers and supermarket-loyal shoppers
Activate these audiences in your campaigns today by contacting uk_agency@loopme.com .
Also available via:
Download data for other markets:
LoopMe surveyed 10,573 US consumers between January 14th – 16th, 2026 to gauge supermarket shopping behaviors and trends.
PurchaseLoop Audiences transformed this research survey data into exclusive, actionable segments, including:
In-store, online, and hybrid shoppers
Factors driving supermarket choice
High-end, mid-range, and discount shoppers
Healthy shoppers
Supermarket switchers and supermarket-loyal shoppers
Activate these audiences in your campaigns today by contacting us_agency@loopme.com .
Also available via:
Download data for other markets:
LoopMe surveyed 3,761 Americans between August 18th – 22nd, 2025 to gauge consumer behavior around perishable foods and produce.
PurchaseLoop Audiences transformed this research survey data into exclusive, actionable segments, including:
Produce shopping habits
Produce type preferences
Purchase decision making factors
Brand loyalty and switching psychology
Activate these audiences in your campaigns today by contacting us_agency@loopme.com
Also available via:
LoopMe surveyed 1,853 Americans between June 9th-12th, 2025 to gauge consumer behavior and preferences around the food & beverage vertical.
PurchaseLoop Audiences transformed this research survey data into exclusive, actionable segments, including:
Grocery shopping habits: in-store, online, or both
Brand-loyal vs. exploratory shoppers
Food & beverage brand trial motivators
Activate these audiences in your campaigns today by contacting us_agency@loopme.com
Also available via LoopMe’s Premium Deals Library , The Trade Desk , and LiveRamp .
LoopMe surveyed 8,876 Americans between June 9th and June 12th, 2025 to gauge consumer habits around alcoholic beverages.
PurchaseLoop Audiences transformed this research survey data into exclusive, actionable segments, including:
In-market alcohol drinkers
In-market zero alcohol drinkers
In-market spirits drinkers
In-market beer drinkers
In-market wine drinkers
Premium alcohol drinkers
Activate these audiences in your campaigns today by contacting us_agency@loopme.com
Also available via LoopMe’s Premium Deals Library , The Trade Desk , and LiveRamp .
LoopMe also conducted research into habits around alcohol in the UK .